


What Is an ERD?
An Entity-Relationship Diagram is used to represent the data we want to have in a system and the relationships between them.
To be able to create such a model, we first need to understand some basic concepts. The most important one is an entity, which represents a unique real-world object. In a diagram, entities are usually named using nouns.
Each entity has properties called attributes. Based on their structure, we can distinguish between simple attributes, which clearly represent one piece of information and cannot be divided further. Examples include a birth number or age. If a property can be divided into several logical parts, we call it a composite attribute. A common example is an address, which can be further divided into a city, street, and ZIP code.
To uniquely distinguish individual records within an entity, we use a special attribute called a primary key (abbreviated as PK). Its value must always be unique – you can think of it as a generated user ID or a birth number. In a diagram, this attribute is marked with the abbreviation PK next to its name. If we want to connect two entities, we place the primary key of one entity into the other as a foreign key (FK). This creates a kind of reference that allows the database to know exactly which record belongs to which.
Once we have defined the entities and their attributes, we need to determine the relationships between them. These relationships are called relationships and are usually described using verbs. For example, student has locker helps us understand what the relationship between the entities looks like. We distinguish between three basic types of relationships: one-to-one (1:1), one-to-many (1), and many-to-many (M).
Drawing a Diagram as Prevention Against Errors
Although drawing diagrams may seem like a waste of time, it is actually a step that helps us prevent errors and complicated database changes. A visual design forces us to think about our data before we start writing code. It is also a great basis for brainstorming – everyone can immediately understand a drawn structure, so several people can discuss it together and decide whether it makes sense.
This makes it easier to discover logical problems such as missing attributes or meaningless relationships. At this point, any changes only mean redrawing a few connections or modifying the text next to an entity. However, once such an error is discovered after the database is already connected to an application, making changes becomes much harder and may require rewriting a large part of the code.
Notation
To make diagrams consistent and understandable to any developer, certain rules were created. These established sets of symbols and rules for using them are called notations. Let's take a look at the three most commonly used notations you may come across.
- Chen notation - The original notation style, where entities are drawn as rectangles, attributes as ovals connected by lines, and relationships as diamonds placed on the connecting lines. It is very visual and easy to understand, but it can take up a lot of space in large databases.
- Crow's Foot - The most commonly used notation in professional database design. The diagram is more compact because an entity is represented as a table, with its attributes written directly inside it. It gets its name from the specific branching symbols at the ends of connecting lines, which resemble a bird's foot and clearly define relationship types (1, M).
- UML (Unified Modeling Language) - Although UML is not primarily designed for creating ER diagrams, its Class Diagram works very well for this purpose. It visualizes data similarly to Crow's Foot, but also allows us to add additional programming details.
Unified Modeling Language
As mentioned earlier, UML is not primarily intended for drawing ER diagrams. It allows us to use different types of diagrams to describe how an entire system behaves, who uses it, and what processes take place inside it.
- Use Case Diagram - Shows who uses the system and what they can do with it (e.g. a customer creates an order, an administrator adds a product).
- Sequence Diagram - Describes step by step how different parts of an application exchange information over time (e.g. the payment verification process).
- Activity Diagram - Works like a clear flowchart that shows the sequence of steps in a particular process.
- State Diagram - Shows the different states that a particular object can go through (e.g. an order changes its state from New to Paid and Shipped).
More information about using these and other diagrams can be found in GeeksforGeeks – Unified Modeling Language (UML) Introduction or Visual Paradigm – What is UML? (Unified Modeling Language Guide)
How to Create Your Own Diagram
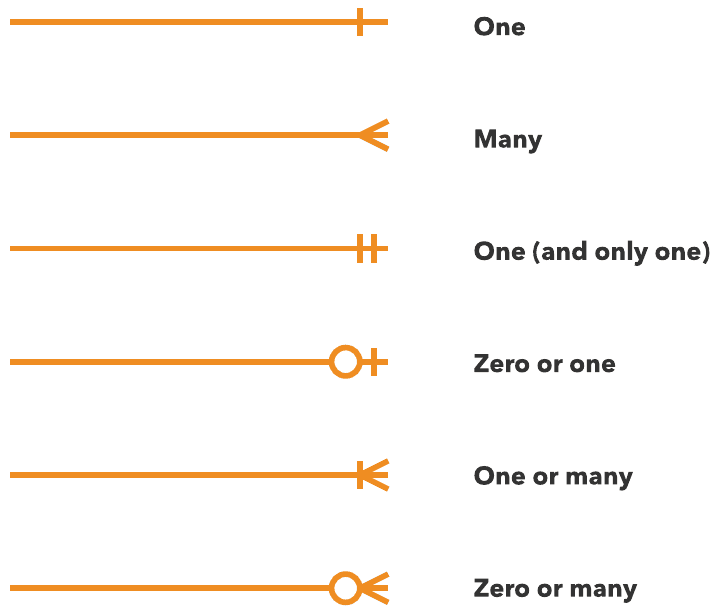
Before we look at a simple diagram, we first need to understand how individual relationships are written. For this example, we will use Crow's Foot notation. The image clearly shows how three symbols at the end of a connecting line can be used to describe the cardinality of a relationship.
Reading Relationships and Cardinalities
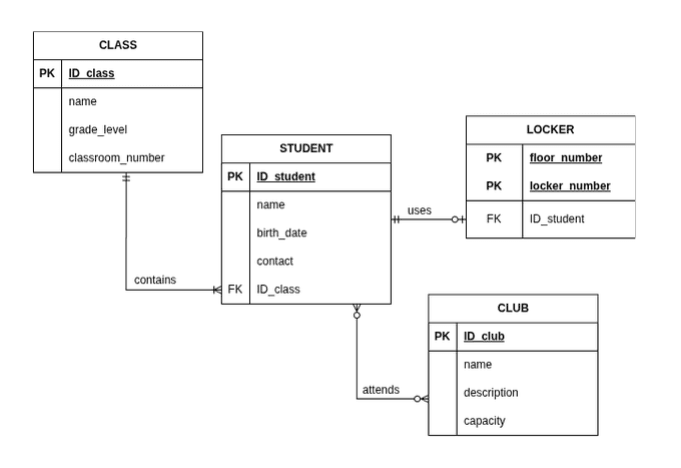
Our diagram contains four entities connected by relationships. Being able to correctly read a diagram is also an important part of understanding it:
- CLASS and STUDENT - Every student must belong to exactly one class. A class can then contain one or more students.
- STUDENT and LOCKER - Every locker is assigned to exactly one specific student. However, a student can have at most one locker and may not have one at all.
- STUDENT and CLUB - A student can attend any number of clubs, but does not have to join any. Similarly, a club can have many students enrolled or none yet.
The LOCKER entity uses a composite primary key. The individual attributes that make up the key (number and floor) can appear more than once on their own, but the combination of both must be unique.
There is no foreign key directly between STUDENT and CLUB, because an M relationship cannot be created directly in a relational database and will have to be modified in the next steps.
How to Continue with the Diagram
The finished diagram represents the logical idea of our data. Before we start writing SQL code based on it, however, there are still a few steps to complete.
The diagram contains composite attributes, and before working with them any further, they need to be split into separate attributes. This is the first step of a process called normalization, which means cleaning up data and removing unnecessary duplicates and inappropriate dependencies. You can learn more about proper normalization in the article What Is Normalization in DBMS? on GeeksforGeeks.
After this adjustment, the ER diagram is converted into a relational model, where data types are added and M relationships are removed. These cannot be created directly in a relational database, so they need to be split into two 1 relationships using a junction table. In the relational model for our ER diagram, a STUDENT_CLUB table would be created with a composite PK (student_id and club_id), which would also be made up of foreign keys. You can learn how to perform this conversion in this guide: Map ER to Relational Model.
After that, all you need to do is choose any database system (MySQL, PostgreSQL, ...) and start creating the tables.
What Tools Can You Use to Create Diagrams?
Tools for drawing diagrams:
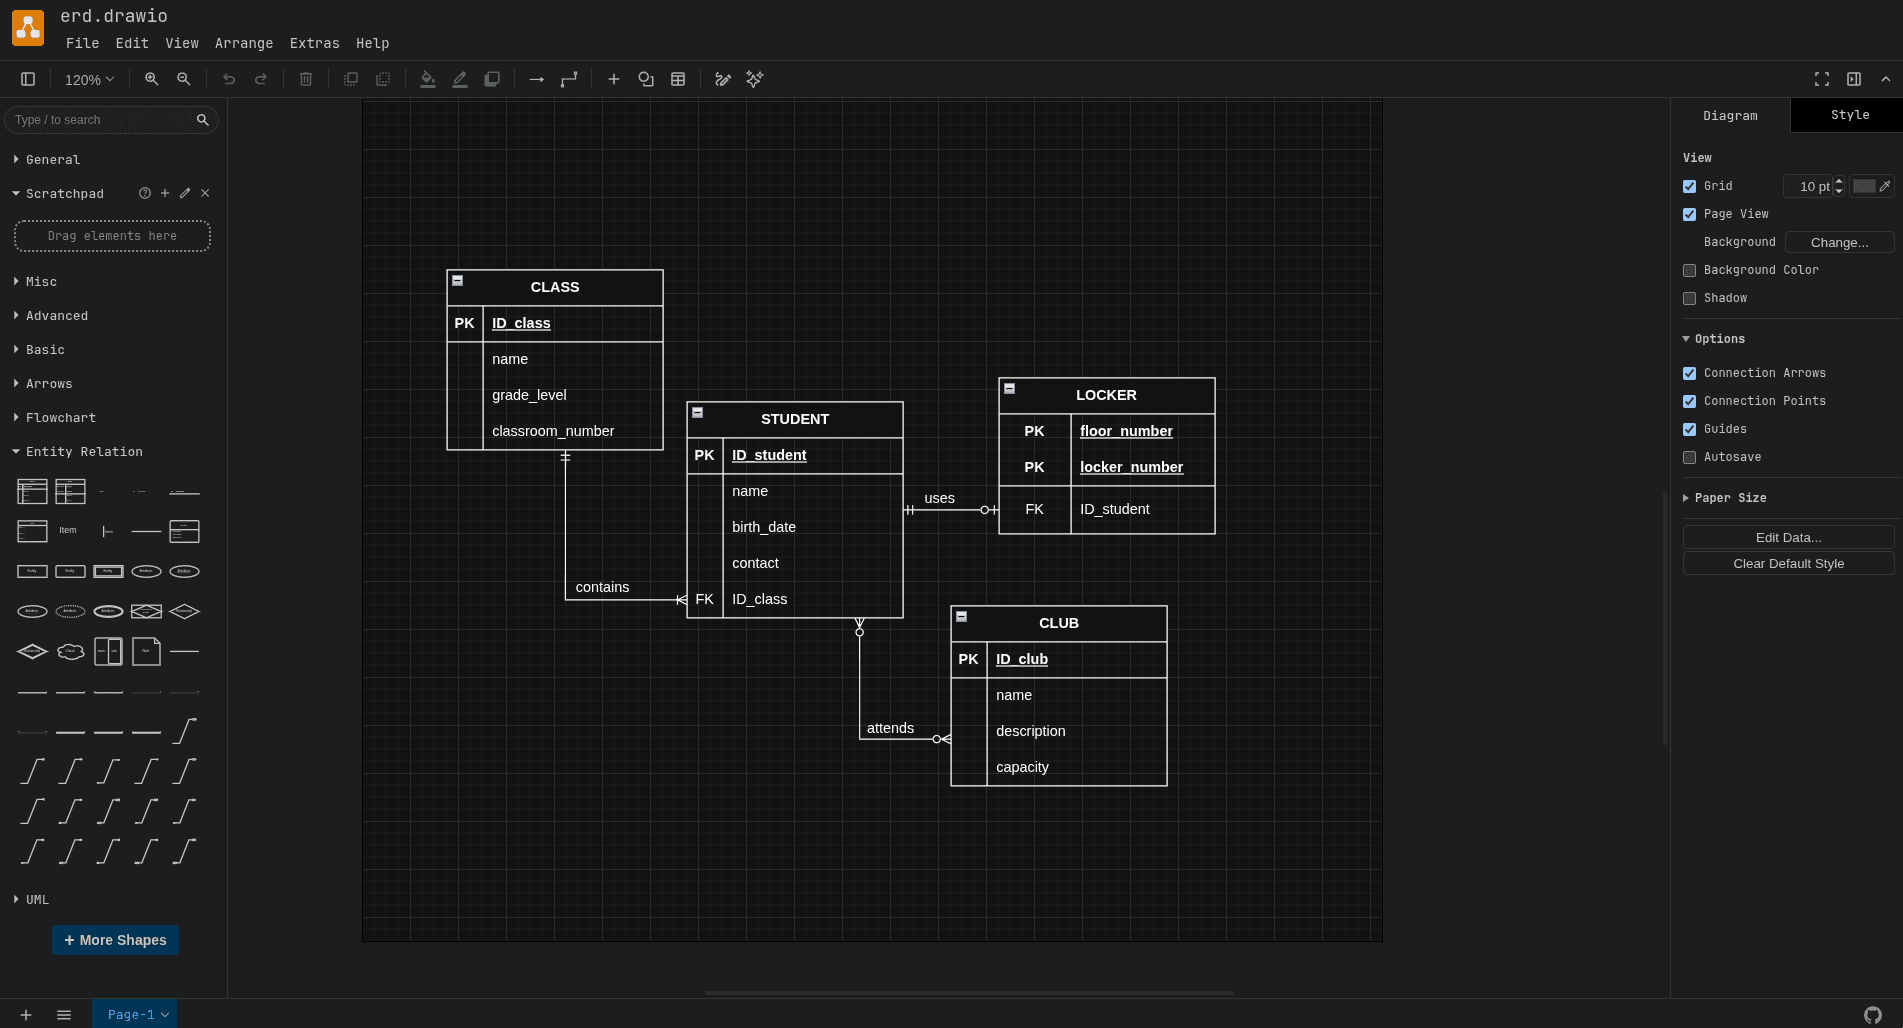
- draw.io: A free online tool for drawing all kinds of diagrams. It contains a complete library of shapes for ERDs, including Crow's Foot notation. Our example diagram was also created with it, and you can find many clear tutorials on their blog. This video also demonstrates how to work with the program: Creating Entity Relationship Diagrams using Draw.io
- dbdiagram.io: A web-based tool where you do not draw the diagram with a mouse. Instead, you write a simple text-based description. The resulting diagram can also be automatically generated as SQL code for creating the tables.
Programy pro práci s databází:
- MySQL Workbench: The official tool for managing MySQL databases. It allows you to create diagrams visually and generate a real database directly from them. It also works the other way around – from an existing database, it can automatically extract and display a clear ERD.
- DBeaver: A universal free database management tool that supports practically any SQL database. From connected tables, it can automatically generate and display an ER diagram with a single click.
© 2026 students can grow, z.s. – Released under the CC BY-NC-SA 4.0. license